Installing APD
Currently, three main ways exist to install APD on a Linux system: grab the source and compile it yourself, use PEAR or use the Debian package.
1. pecl install apd
2. Edit php.ini file
zend_extension = /usr/lib/php/modules/apd.so
apd.dumpdir = /var/log/pprof
3. Don't forget restart Apache :)
Test & debugging
First make sure APD is is installed properly ... for this check phpinfo() API. Now add apd_set_pprof_trace() API where you would like debug.
Gathering Some Data
Look at apd.dumpdir folder . pprof tracefile has been written out here. A pprof tracefile is a text file that contains a machine-parsable summary of how your PHP was processed. suppose output file is pprof.08871.0 ,The number is the process ID of the Web server process that handled the request.
Interpreting The pprof Tracefile
APD comes with a little shell script written in PHP, called pprofp, that can be run from the command line to parse the pprof tracefile and give you a human-readable report. To use it, run pprofp and pass it an option and the path of the tracefile, like this:-
pprofp -u /var/log/pprof/pprof.25802
-a: sort by alphabetic names of subroutines.
-l: sort by number of calls to subroutines.
-m: sort by memory used in a function call.
-r: sort by real time spent in subroutines.
-R: sort by real time spent in subroutines (inclusive of child calls).
-s: sort by system time spent in subroutines.
-S: sort by system time spent in subroutines (inclusive of child calls).
-u: sort by user time spent in subroutines.
-U: sort by user time spent in subroutines (inclusive of child calls).
-v: sort by average amount of time spent in subroutines.
-z: sort by user+system time spent in subroutines. (default)
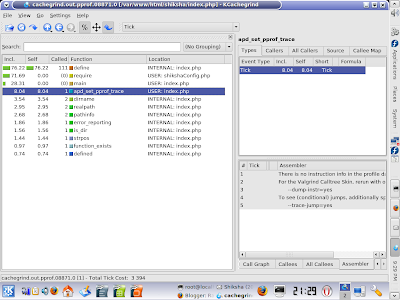
if you found any difficulty , then use kcachegrind tool ... it's free tool and probably installed on each machine.
1. pprof2calltree -f pprof.08871.0 ( it will return a file that is readable by kcachegrind ).
2. kcachegrind cachegrind.out.pprof.08871.0 report will shown like this ...

Links:-
http://in.php.net/apd
No comments:
Post a Comment